| | | |
 Uploading .... Uploading .... Overview Ivan tackled the interesting case of a misbehaving sensor in a Honda electrically-assisted steering system.
- DANGEROUS Honda Electric Steering (Severe Pull)
This case revealed operation and waveforms associated with the steering torque sensor whose operation is not immediately obvious. o experiment a little bit I created a plausible model in LTSpice. You may find it useful to open this page in two or more separate windows to be able to compare waveforms and schematics with each other. Depending on your available screen space, quantity of smartphones and tablets, etc. :-)
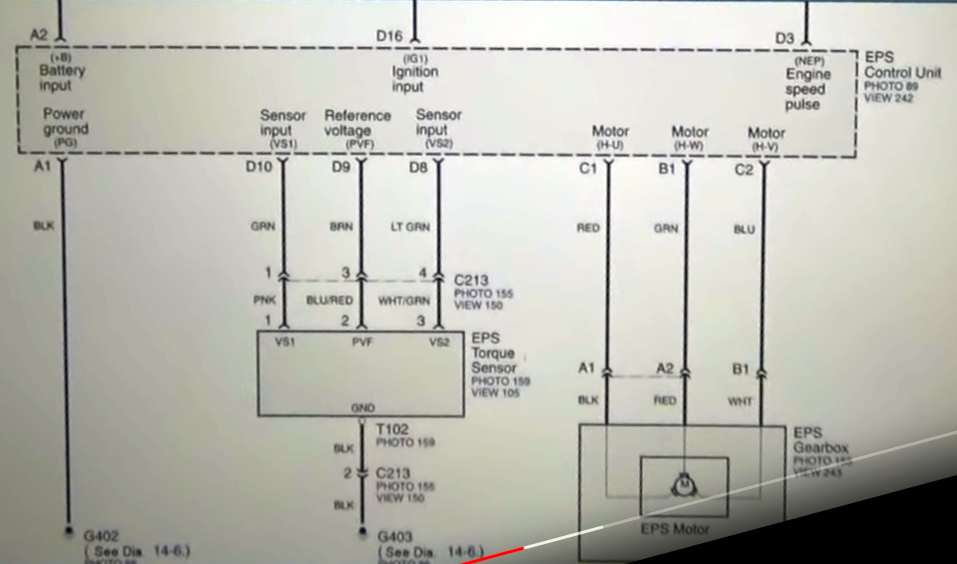
Initial theory of operation - The service data describes the steering Torque Sensor as consisting of a pair of inductors whose inductances are changed by torque in the steering assembly as the driver manipulates the steering wheel. Essentially these inductors work like a pair of LVDTs. It's evident that the EPS (Electronic Power Steering?) control module has to measure these inductors to deduce the torque.
- The measurement interface consists of a "stimulus" signal PVF (not really a reference voltage per se), and two signals returned from the sensor to the EPS, VS1 and VS2.
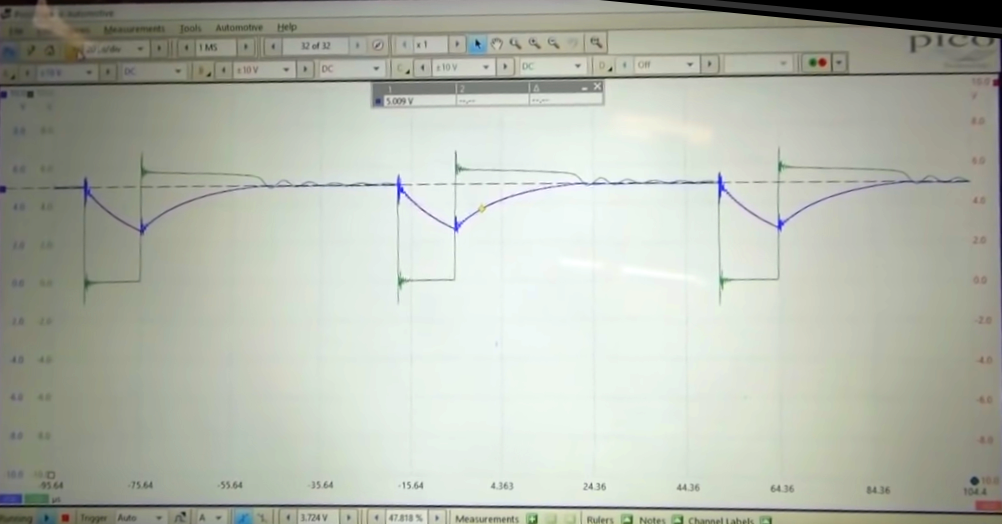
- In the diagram below:
- Green: PVF
- Blue VS1
- Red VS2, hard to see as it parallels VS1 closely.
- I believe the time scale shown here is 20 usec/div, so that the pulses are approximately every 70 or 75 usec, making a ~14 kHz repeat rate.
Defect symptom spotted by Ivan 
- With no torque applied to the steering wheel, the blue trace (VS1) was not following the same waveform as the red (VS2) trace.
- The EPS module could not learn its way out of this discrepancy, instead reporting that the VS1 channel was unable to calibrate. And in normal operation treating this input value as torque applied to the steering wheel (and thus trying to "assist").
- Let's summarize this issue as "Insufficient excursion of the VS1 signal".
LTSpice model of steering sensor circuit
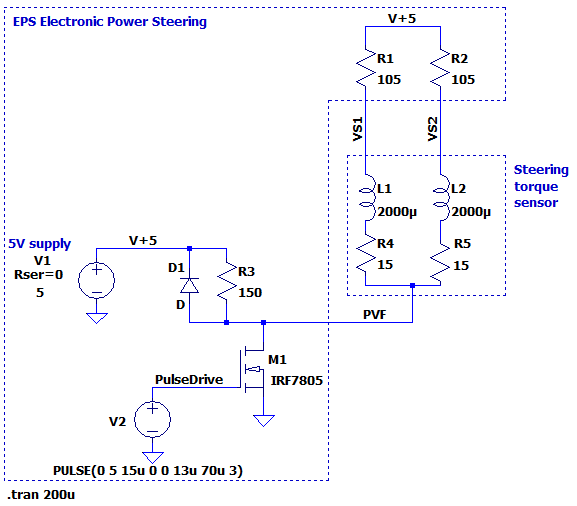
Here is an LTSpice model schematic which produces very similar waveforms to the above, (minus some ringing that is likely due to inductance and capacitance in the wiring harness and so on).
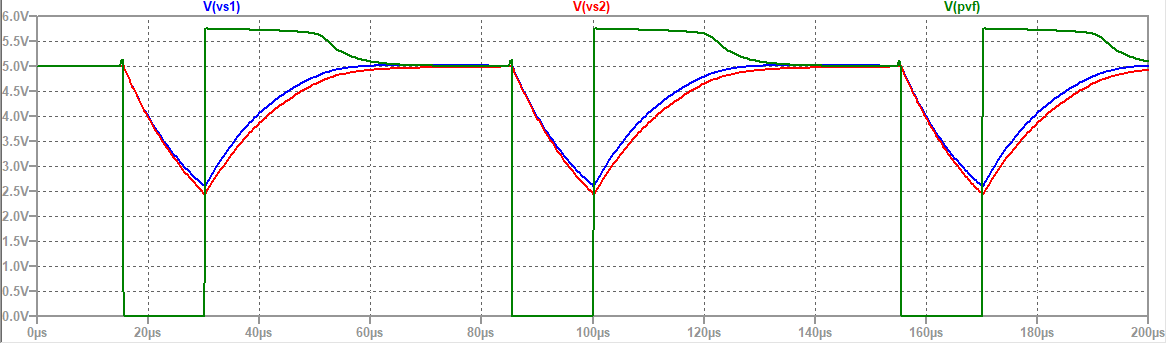
The waveforms are as follows: 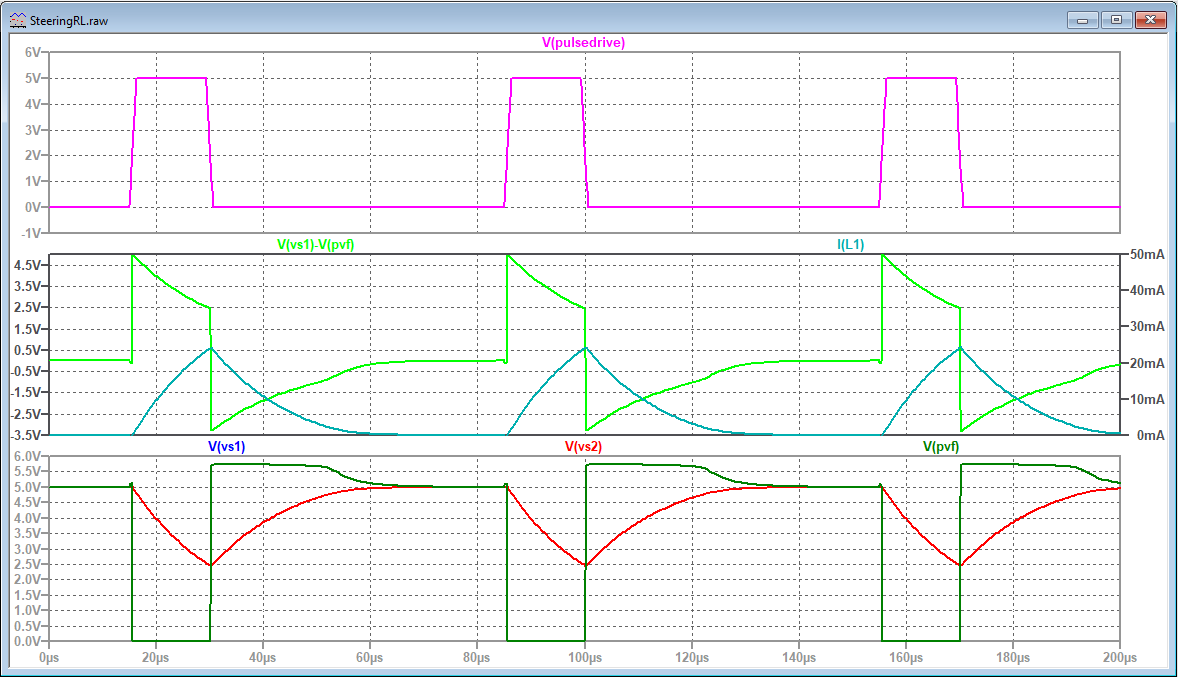
- Matching Ivan's scope traces, in the lower pane:
- Green is PVF, and blue and red are VS1 and VS2 respectively, though blue is the same as red, and hidden behind it.
- In the upper pane, the pink signal is the "PulseDrive" signal that switches the MOSFET M1 to create the PVF signal, and is there just for reference.
- The middle pane shows two additional signals of interest:
- The voltage across one of the coils (including its resistance).
- The current through the coil L1 (which is the same as the current through R4 and R1).
- The sensor probably consists of simply two coils (L1 and L2), whose wire resistance we can show as a series resistance (R4 and R5).
- We can be pretty certain that there are pull-up resistors in the EPS on wires VS1 and VS2.
- We know that the EPS switches the PVF line to ground. There are a few extra components to explain what PVF does after the end of the pulse.
Default operation - Starting point: M1 initially OFF (and has been for a while)
- No current is flowing in R1, L1 and R4, so VS1 = V5 (ie: R1 pulls up VS1 to net V+5, which is +5V).
- PVF is pulled up to +5V also, both by R3, and by R1-L1-R4 (and also R2-L2-R5.
- PulseDrive goes high
- Turns on M1,
- ...shorting PVF to ground.
- This places 5V across R1-L1-R4,
- which starts to increase the current in that path, and that increase is held to an almost linear sloping ramp by L1.
- The ramp will be steeper the lower the value of L1's inductance.
- This increasing current creates an increasing voltage across R1, and since the high side of R1 is fixed to 5V, the low side of R1 (VS1) follows a ramping-down line.
- After some precise time (about 15 usec), the pulse ends
- Presumably just prior to this time the EPS unit measures the voltages of VS1 and VS2 to determine how far did the ramp progress in the fixed timeframe, and thus what is the value of each of those inductances.
- Once the pulse has ended, the magnetic energy stored in the inductors' magnetic fields is no longer held there by an ongoing current, and starts to "collapse" out of the field into a current produced by the coil.
- Ie: the action of the coil is to try to keep the current in the same direction as it was before. But instead of the current being driven by the external circuit, now the coil is driving the current -- it is the current source. The current can be seen in the middle pane turquoise trace I(L1), scale on the right side. That current was positive and ramping up, now it's still positive, but ramping down. The voltage across L1+R4 (VS1-PVF) was positive while the coil was receiving current, now it's negative as the coil is acting like a battery of sorts.
- This causes PVF to become positive relative to the +5V rail.
- With M1 switched off, the current would have no easy path to follow from PVF, and the voltage would rise very high. ("Flyback" voltage) However, we have D1 and R3 as a path for the current. D1 conducts at about 0.7V, so that holds the maximum PVF voltage to 5.7V (lower pane dark green trace).
- Apparently there's also some resistance (R3) in parallel with D1, which influences the gradual curve of PVF after it sinks below the D1-constrained 5.7V.
- R3 is also useful when the sensor is unplugged, as it functions as a pull-up for M1. Without R3, the voltage at PVF would stay at zero volts, regardless of whether M1 was off or on. The EPS likely monitors PVF to determine whether M1 is functioning or not, diagnose shorted wiring, and so on.
Variation due to change of inductances 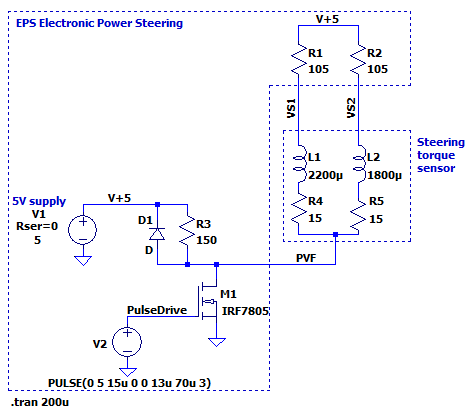
- The only change is to increase L1 by 10%, and decrease L2 by 10%. We assume that as torque is applied to the steering wheel, one inductance increases, and the other decreases, by about the same proportion.
- Click waveform image to expand
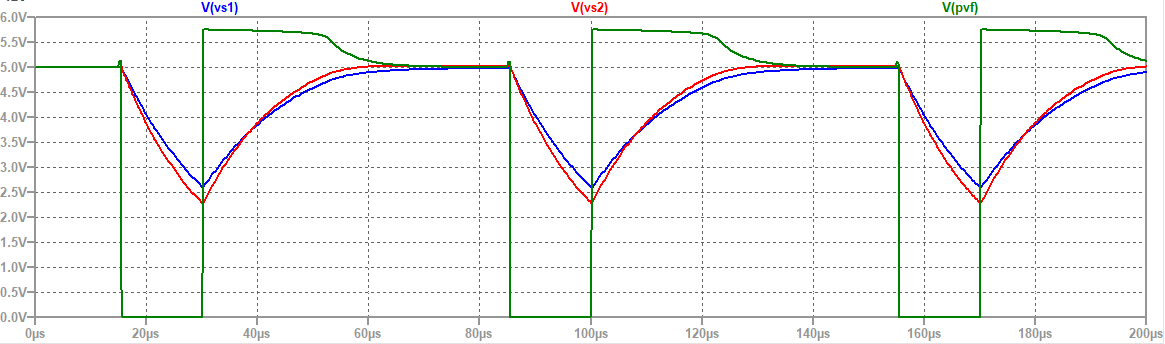
- The effect of increasing inductance is to reduce the slope of the ramp, and thus reduce the amount that the signal has traveled by the end of the measuring pulse. Vice versa for decrease in inductance. So the effect is that the two signals that both "touched" the nominal "neutral" 2.5V at the end of the pulse time, now split to above and below "neutral".
Variation due to increased resistance in VS1 or VS2 wires 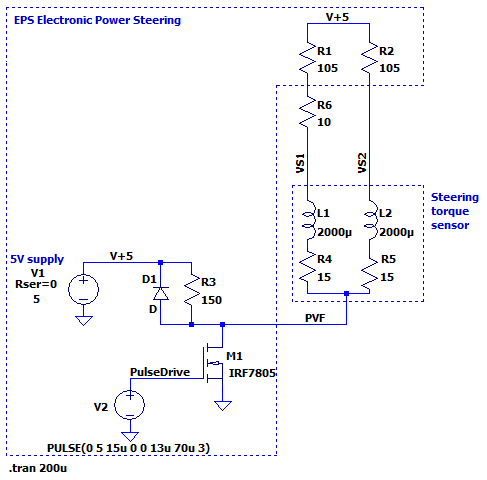
- L1 and L2 restored to equal.
- A "bad connection" extra resistance inserted in the VS1 wire
- Click waveform image to expand
 - Explains Ivan's observations? An increased resistance in the wiring is one possible explanation that could have explained the symptoms that Ivan saw.... or maybe not!
- Compare this waveform to the one above in section "Defect symptom spotted by Ivan"
- Dashed expectations? We may have expected the addition of R6 in the VS1 wire to decrease the current and thus reduce the excursion of VS1 (causing it to end the pulse at a voltage above 2.5V, like in Ivan's observation. However, the opposite happens! Why?
- Throughout the ramp, the current is restricted more by inductor than by the resistance of R1+R6
- We know this because if the "resistance" of L1+R4 was less than R1+R6, then immediately on switching on M1, the voltage at VS1 would drop to less than half of the 5V supply. But it doesn't. It makes its way down "slowly". Only as the ramp reaches around 2.5V is the influence of R1 equal to that of L1+R4.
- So this means that the 10% increase to the VS1 pull-up resistance causes only a small decrease in the current, but whatever that slightly-decreased current is, the resulting voltage across R1+R6 is 10% more than it would have been with just R1.
- Net result: Increased resistance in VS1 wire would seem to increase the signal measured on the scope at the VS1 terminal on the sensor.
- What the EPS would see. That said, if the added resistance is in the wire (or connection) between sensor and EPS module (as represented by R6) , the EPS module won't see the increased voltage. It's still measuring a voltage across plain R1, and with the reduced current it will indeed see a reduced excursion of the VS1 signal.
- However, that's not the case documented by Ivan. He read an insufficient excursion of VS1 at the sensor.
- What about reduced R1?
- Since we've noted that an increase in the VS1 pull-up resistance moves the VS1 signal in the direction opposite to Ivan's observed issue, we would conclude that a reduced resistance of the VS1 wiring, or of R1, could explain the observation. Obviously reduction in wiring resistance is not possible. However, R1 could conceivably reduce, for example due to water and salt ingress into the EPS or similar, though it seems unlikely.
Variation due to increased inductor resistance 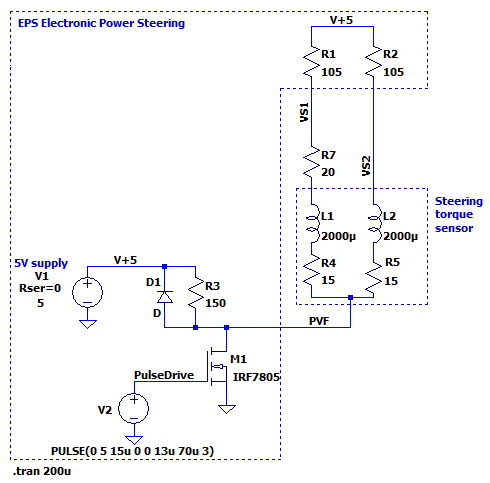
- Added R7 to represent increased coil resistance
- Click waveform image to expand
- As can be seen, this produces a waveform in which the blue VS1 signal has a reduced excursion, which mimics Ivan's observations.
- How is this different from previous example?
- This example appears to add a resistance in the VS1 line just like the previous example, which did not match Ivan's observations.
- But, in this example, the VS1 wire is on the high side of the unwanted resistance. As noted in the previous example, the added resistance does somewhat reduce the current. But unlike the previous example, the VS1 signal (ie: where Ivan measured the signal) is across the normal R1 (105 ohms). So the reduced current produces a reduced excursion of VS1 voltage.
PVF-side issues? We're not concerned with issues on the PVF side of the sensor, since that's shared by both inductors, and we know that one of them works.
Summary - We've observed how the VS1 and VS2 signals change relative to changes in the inductances L1 and L2, and also relative to changes in the VS1 pull-up resistance.
- Ivan's observation of "insufficient excursion in the VS1 signal" could be explained by:
- Increased resistance of L1 (or the L1 path inside the sensor).
- That could be due to corroded connections or wires inside the sensor.
- Increased inductance in L1
- Could be due to some mechanical fault such as the coil has got dislodged moved to an improper location, or the compliant torque connection between input and output shaft has worn or failed in some way.
- Decreased resistance in the R1 VS1 pull-up in the EPS.
- Ivan's observation does not seem to be due to the following, which would increase the excursion of signal VS1 :
- Bad wiring or connectors in the VS1 wire
- Shorted winding in L1 (that would reduce inductance)
Download LTSpice model See the attachments at the bottom of the page to download a model for LTSpice. - For those unfamiliar: LTSpice is a widely-used environment for simulating electronic circuits, and probably the most widely-used of the several descendants of the original SPICE software. It is free to download and use.
Related links- Electric Power Steering Hack
- Experiment on Honda S2000. "This mod adjusts the amount of power steering assist provided by the EPS system from "full factory assist" to an estimated "10% of factory assist". It does this by reducing the signals sent from the steering torque sensor to the EPS computer, essentially telling the computer you are applying less torque to the steering wheel, and in turn the computer provides less power assist."
- https://modifry.com/freebies/eps.htm
|
|
|
| | | |
|